5 Key Metrics To Measure Video Success
Video has become an essential tool to engage and connect with audiences across the customer lifecycle – not just to raise awareness but also to drive marketing, sales, and customer experience goals. But it’s not enough to simply create and deploy video content – capturing metrics that measure impact on business objectives is crucial. In this post, we discuss key metrics for video and guidance for measuring video success.
Key Metrics and What to Measure
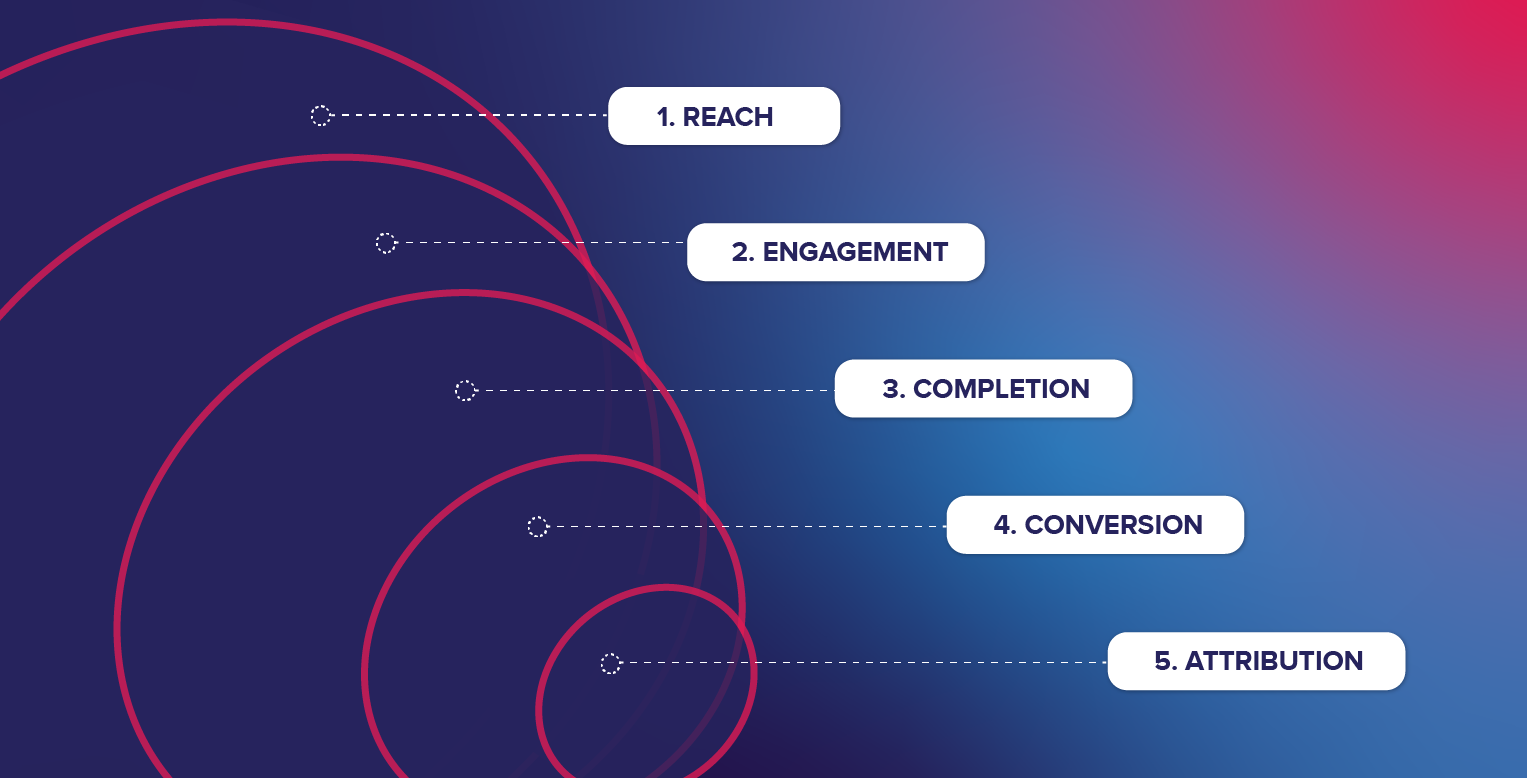
1. Reach
Measuring reach is a first step in understanding the impact of your videos. View count is a well used metric, indicating the number of people who have watched your video and initial engagement. However, on its own reach is limiting – additional metrics will help you to understand engagement on a deeper level.
2. Engagement
While reach gives an indication of how many people have watched your video, measuring engagement can provide insight into retention of viewers. For example, minutes watched can indicate content effectiveness, and understanding drop-off points in your videos can help pinpoint areas for fine tuning. Tools, such as the one found in Vimeo or Vidyard, provide a graph of viewer engagement across the video and can enhance your understanding of audience’s viewing behaviors.

3. Completion
Video completion rates reveal the percentage of viewers who watch the video until the very end. A recent industry benchmark report shows 66% of viewers will finish a video in under 1 minute long, while videos over 2 minutes have completion rate of 50% or less. Low completion rates can indicate issues with content length, relevance, or quality and if your viewer fails to complete the video they may well miss your concluding CTA.
66% of viewers will finish a video that’s under 1 minute long, while videos over 2 minutes have completion rate of 50% or less
4. Conversion
Conversion metrics track the number of viewers who take a desired action after watching a video, such as filling out a form or clicking a button. Measuring conversion rates allows you to assess how the video contributes towards meeting business goals and establish ROI on video investments. In the same report, average video CTAs is 3.21%, knowing your CTA gives you an indication what your Reach and Engagement goals should be.
The average video CTA is 3.21%
5. Attribution
You can attribute further success of videos by tracking and combining your video data with your Marketing, Sales, and CRM platforms data. This more sophisticated metric, allows you to attribute video success to broader business goals, such as customer growth, revenue, and cost savings. Helping you build a stronger business case for future funding for video content production.
Bonus: Benchmarking Your Videos
As you continue to produce video content and build a library, you will be able to analyze and benchmark video success. For example, what are your 5 top performing videos? What are the trending topics? How are things changing month by month, or quarter by quarter? Being able to rank and compare provides a long term view and informs a more strategic approach to developing consistent, seasonally relevant, content across the calendar year.
Ready to integrate video into your CX strategy?
Anton Artemenkov
Creative Director
Sutherland Labs
Anton Artemenkov
Creative Director
“Storytelling is the most powerful way to put ideas into the world today” said Robert McKee. Anton is our master storyteller, bringing to life data insights and customer journeys through narrative, visual design, and creative communications. With over 18 years of leading creative projects for the likes of Disney, ESPN, Johnson & Johnson, Cigna, Hiscox, SAP and Mars. His passion for stories has also seen him produce the ‘Analogue Tribes’ documentary films, launch the Photographers Dining Club, and win Photographer of the Year twice. As a kid, he had a pet hedgehog. Honest.