Trello x User interviews: Analyzing, synthesizing and sharing results
Trello is useful for just about everything from analyzing interviews, to developing journey maps or service blueprints, to organizing todo lists. Originally, I started using Trello to do remote co-analysis with a colleague in Boston. Since then, I’ve realized how powerful it is for side-by-side analysis and as a flexible and low-fidelity way of sharing and communicating research results. For folks who prefer post-its and a white wall, Trello is a great place to keep a record of the synthesis as post-its tend to inevitably fall off the wall.
Here’s a workflow that I’ve found works well for analyzing and synthesizing user research. This approach tweaks David Ghent’s method adding detail based on my workflow. For example, I found that typing research insights into Trello directly during sessions is unwieldy. I prefer to import insights from my transcript notes after the interviews, and to have separate interview notes to refer back to at anytime.
Stage 1: Setup the board
Create a new Trello board
Create a new Trello board that will be the home of all the data input and analysis. You can make a copy of this template I created as a starting point.
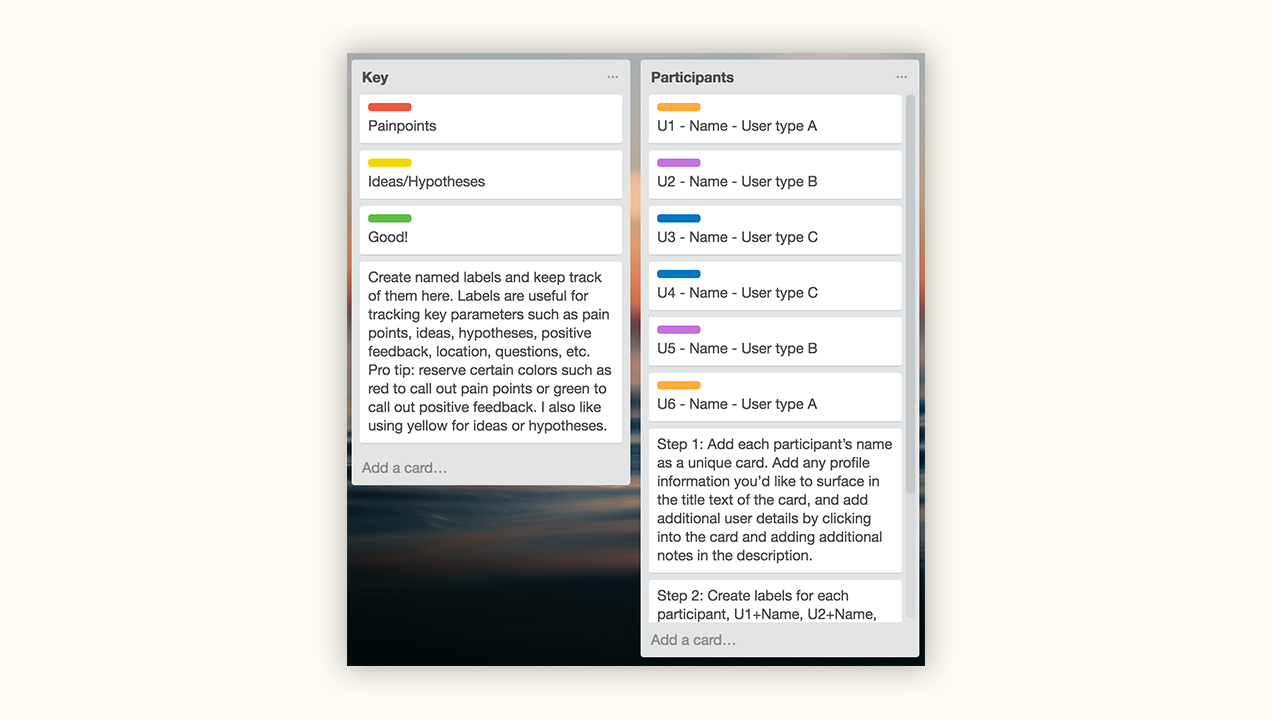
Create a first column, “participants” and populate
Add each participant’s name as a unique card. Add any profile information you’d like to surface in the title text of the card, and add additional user details by clicking into the card and adding additional notes in the description.
Create preliminary named labels
Labels are a good way to see at a glance who or how many people said what. It is also useful for tracking key parameters such as pain points, ideas, or hypotheses.
- Create labels for each participant, U1+Name, U2+Name, etc. If you have one type of participant, label each participant a distinct color. For different types of participants, use label colors to represent a participant type, e.g. employee vs. consumer.
- Create additional named labels such as pain points, to call out positive feedback, location, ideas, hypotheses, questions, etc. Pro tip: reserve certain colors such as red to call out pain points or green to call out positive feedback. I also like using yellow for ideas or hypotheses.
Create preliminary columns
Name columns based on categories such as touch points, channels, steps in a user’s journey, research questions, personas, etc. The categorization doesn’t have to be perfect at this point. Column names will change and evolve in the following phases. In a website user testing scenario, columns could be labeled: landing page, sign up flow, about us, mobile, etc. Creating a “key” column can be useful if there are many labels to keep track of.
Once these initial elements are in place, you’re ready to get started with entering user data and the first stage of analysis.
Create key columns for participants and callouts
Notes on collaboration: as you set up the board, discuss and share labeling and naming with teammates so that everyone is familiar with the lay of the land.
Stage 2: Enter interview data
Process the interviews one by one
Starting with the first participant, start populating columns with cards containing research insights or quotes + annotations. When copy/pasting quotes, make sure to note down the participant number, e.g. “U1 – I couldn’t figure out where to sign up”. Then when other participants say similar things, attach their label to the same card without losing track of where the quote originated from.
Attach relevant labels to each new card as you go
Create new labels as you go, but make sure to attach the relevant label to previously created cards. Use participant labels to count users that share similar attributes, e.g. “prefers working from home”.
Rename/create columns as needed
As you process each interview, adjust or create columns as needed to reflect the evolving understanding of nuanced findings. The titles of new/adjusted columns can become research insights.
Copy shared insights across columns
If an insight is shared across multiple columns make use of Trello’s copy functionality.
Add detail to cards by adding descriptions or by adding images
At this stage, concentrate on capturing the data in the right columns and labels. Don’t worry if some columns are extremely long, while others are sparsely populated. Once you’ve processed all your interviews, you’re ready to move on to the next stage. If you want to keep your raw data separate from the synthesis, you can make a copy of your whole Trello board.
Notes on collaboration: split up the interviews with collaborators. Keep them abreast of any changes you make to labeling or new columns that they might want to be aware of.
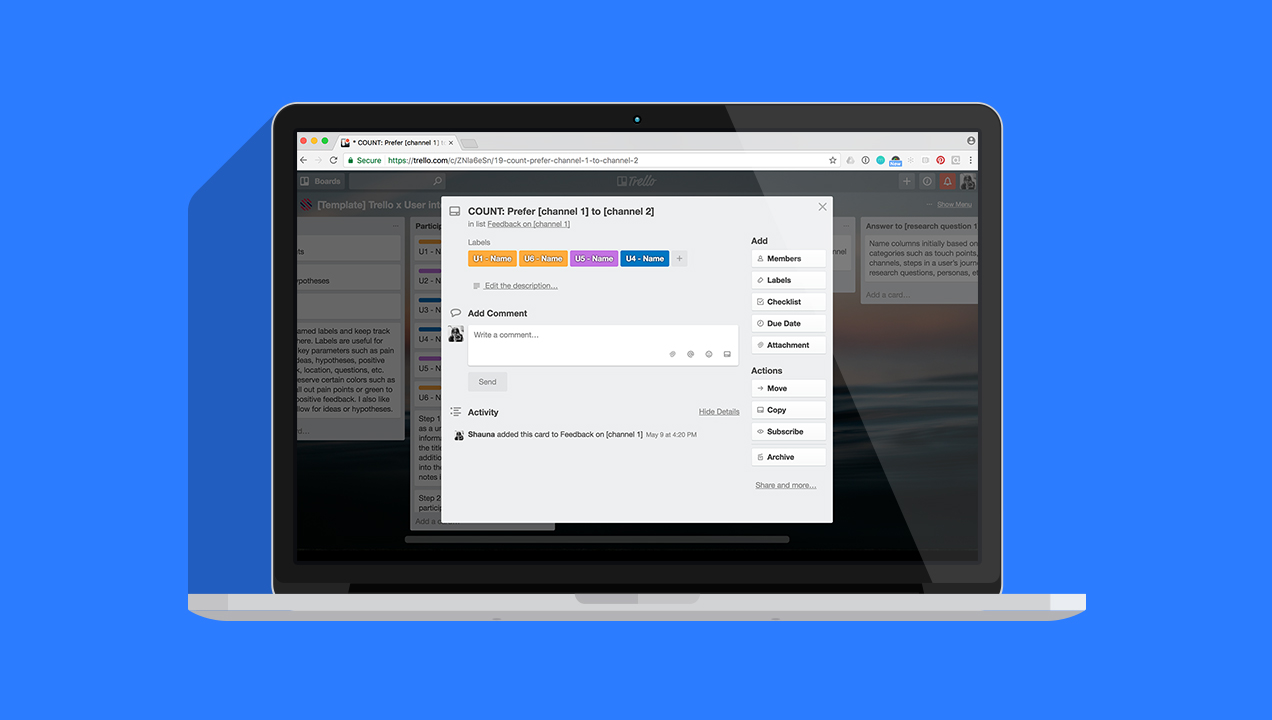
Example of a card showing 4 participants labeled, that agreed with a particular research finding
Stage 3: Synthesize findings
Take stock of your current board. It’s time to condense down the findings.
Adjust, condense, and expand columns where necessary
Scan over the columns. Check that the titles make sense and that they are not redundant with other column titles.
- If a column still contains many cards, try to break it up into two or more columns.
- If a column has only a few cards, see if it might be combined with another column.
Going column by column:
- Condense and check for redundancy across cards. Try to limit the number of cards in one column so that there’s no need to scroll too much.
- Finalize counting by double checking labeling
- Check that columns represent the labels contained within. Rename columns where appropriate.
Repeat steps 1-2 until satisfied
Note on collaboration: if you can, sit side by side to digest down and agree on the research findings.
Step 4: Make findings communicable (optional)
Read over your board with an outsider’s eye. Add additional details to make sure that someone who wasn’t involved in the research would understand the findings. If you did it right, you can almost copy column titles as findings into your research report with supporting quotes, etc.
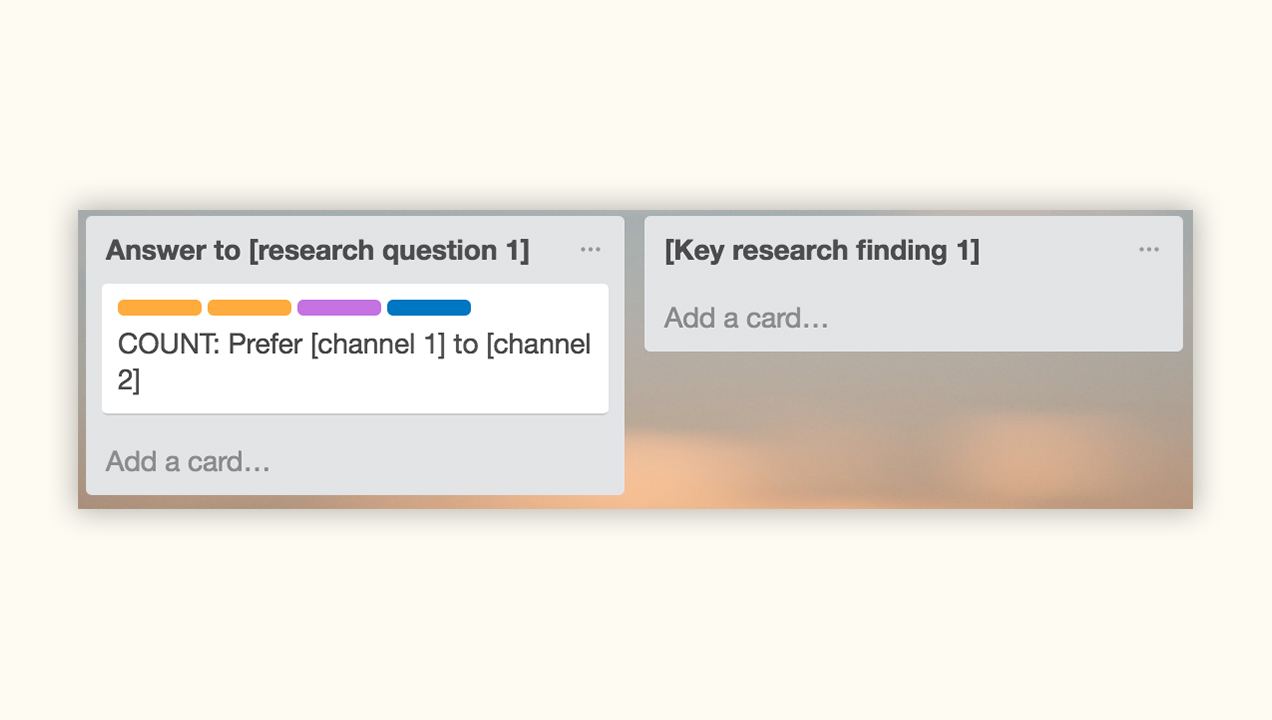
Columns can be re-named during synthesis to reflect key research findings. The attached cards provide supporting evidence.
As you get comfortable with this general process in Trello, adjust the process to your own workflow. I’ve found that the way I organize or conceptualize columns or labels can vary depending on the type of project. With larger projects, I may use multiple boards and copy cards or columns across boards. For example, if your next step is making a journey map in Trello, it’s likely that you can copy steps, sub-steps and pain points across boards.
Extra notes:
I learned the hard way that Trello allows changes in offline mode, but does not save changes.
The Labs Team